
What is Data Visualization?
Data visualization is the representation and presentation of data to facilitate understanding (Kirk, 2016).
Effective data visualizations make it easier for people with diverse backgrounds and experiences to understand challenges and take action on them.
Data Visualization for Advocacy & Impact
Click here to review a recording of “The Power of a Picture: Data Visualization for Advocacy & Impact.” This digital workshop was held in June 2020, hosted by Buffalo Commons (Partnership for the Public Good) and the Buffalo Co-Lab (The ILR School, Cornell University).

Helpful Practices and Examples
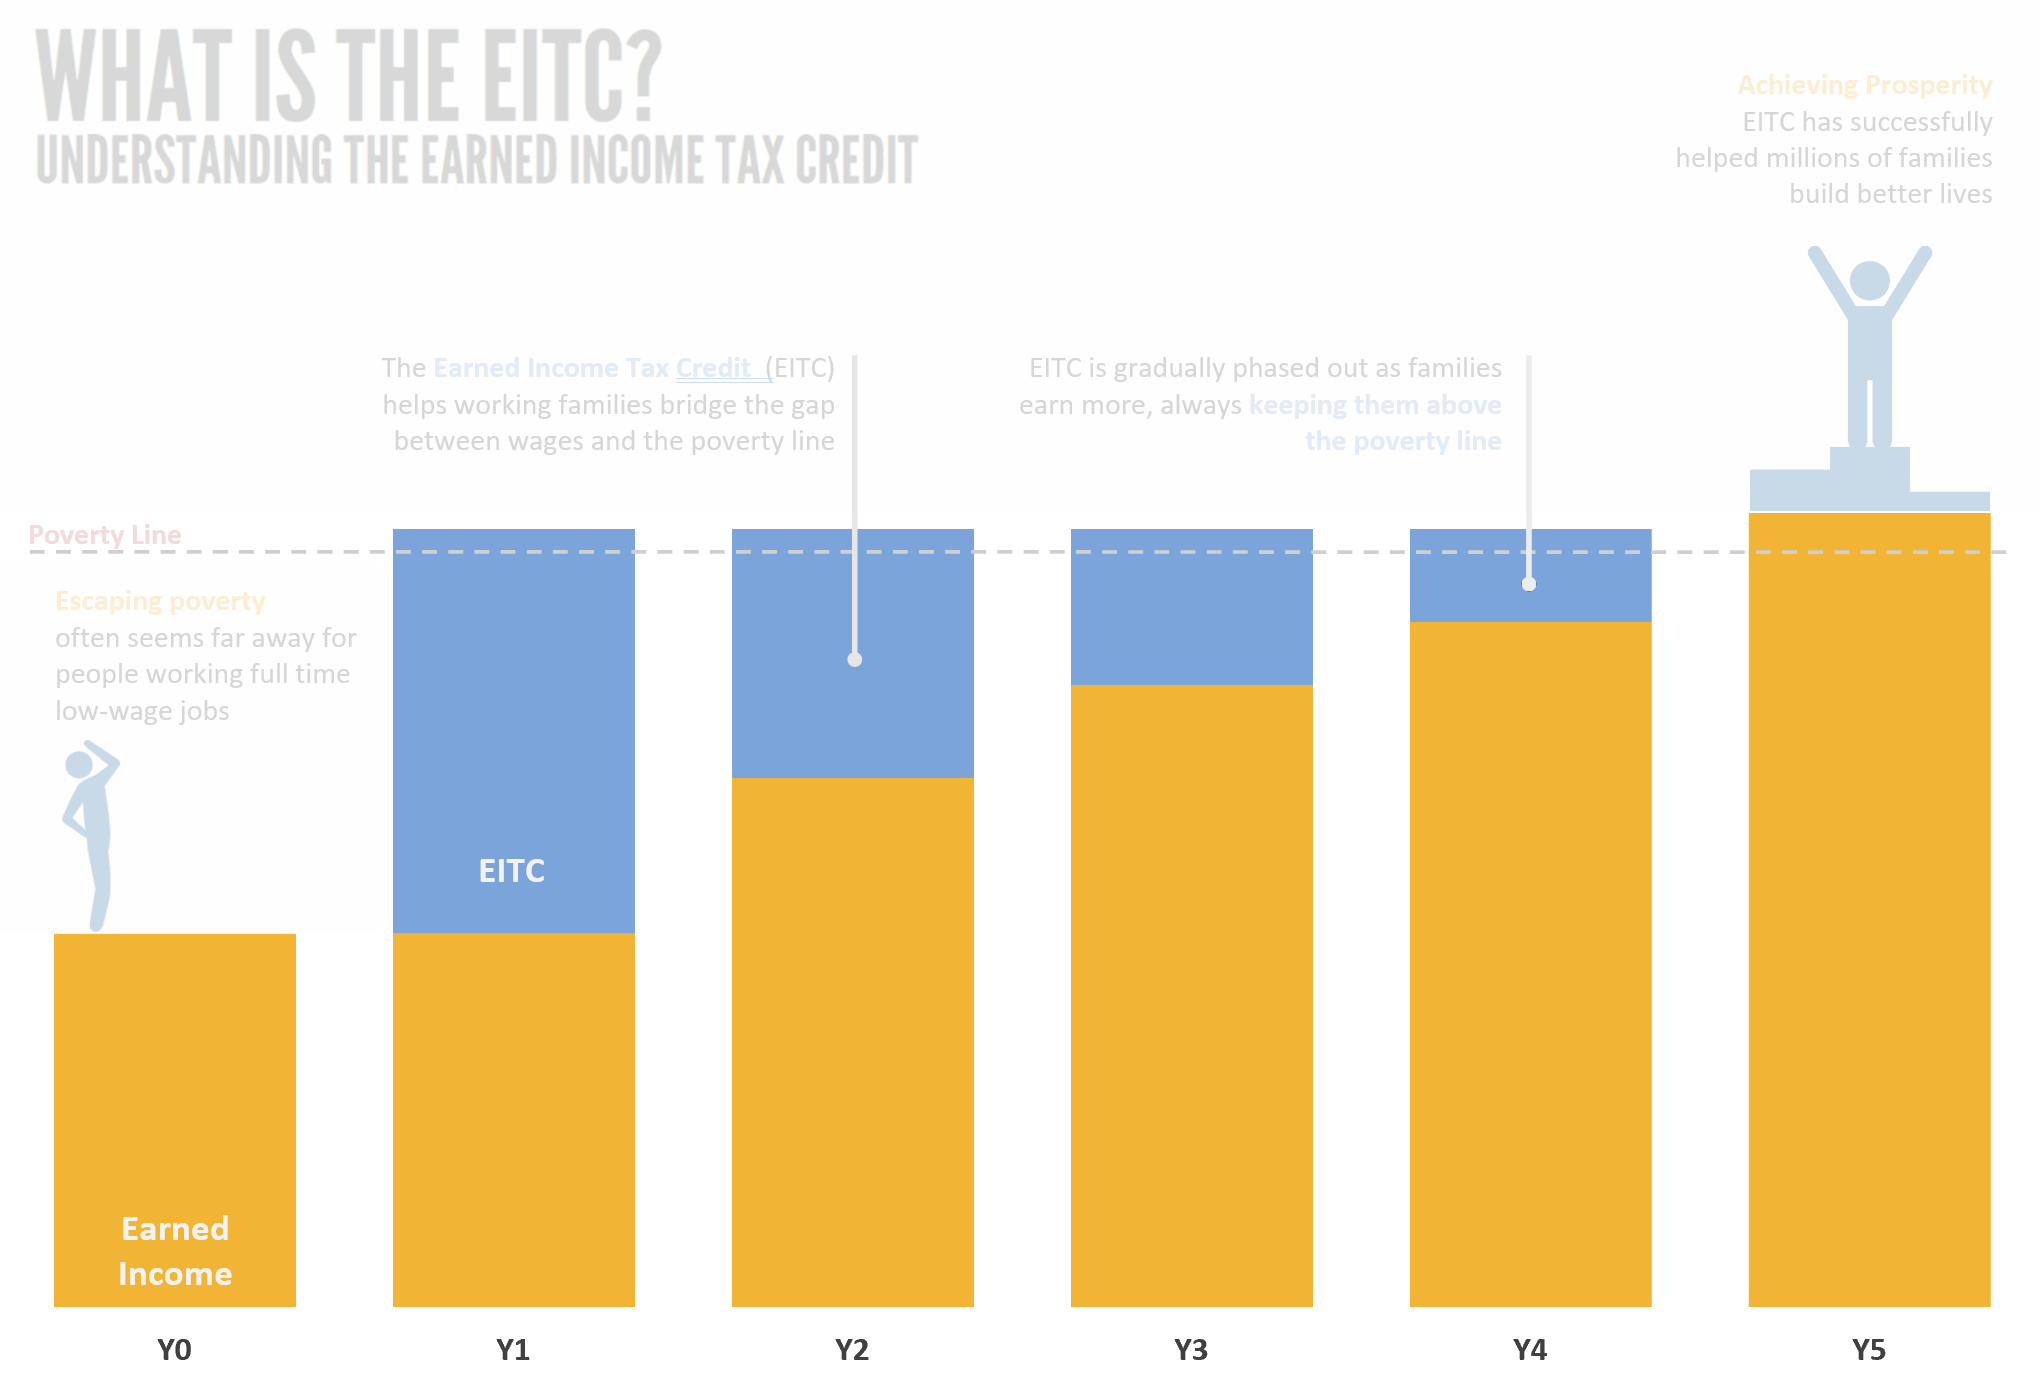
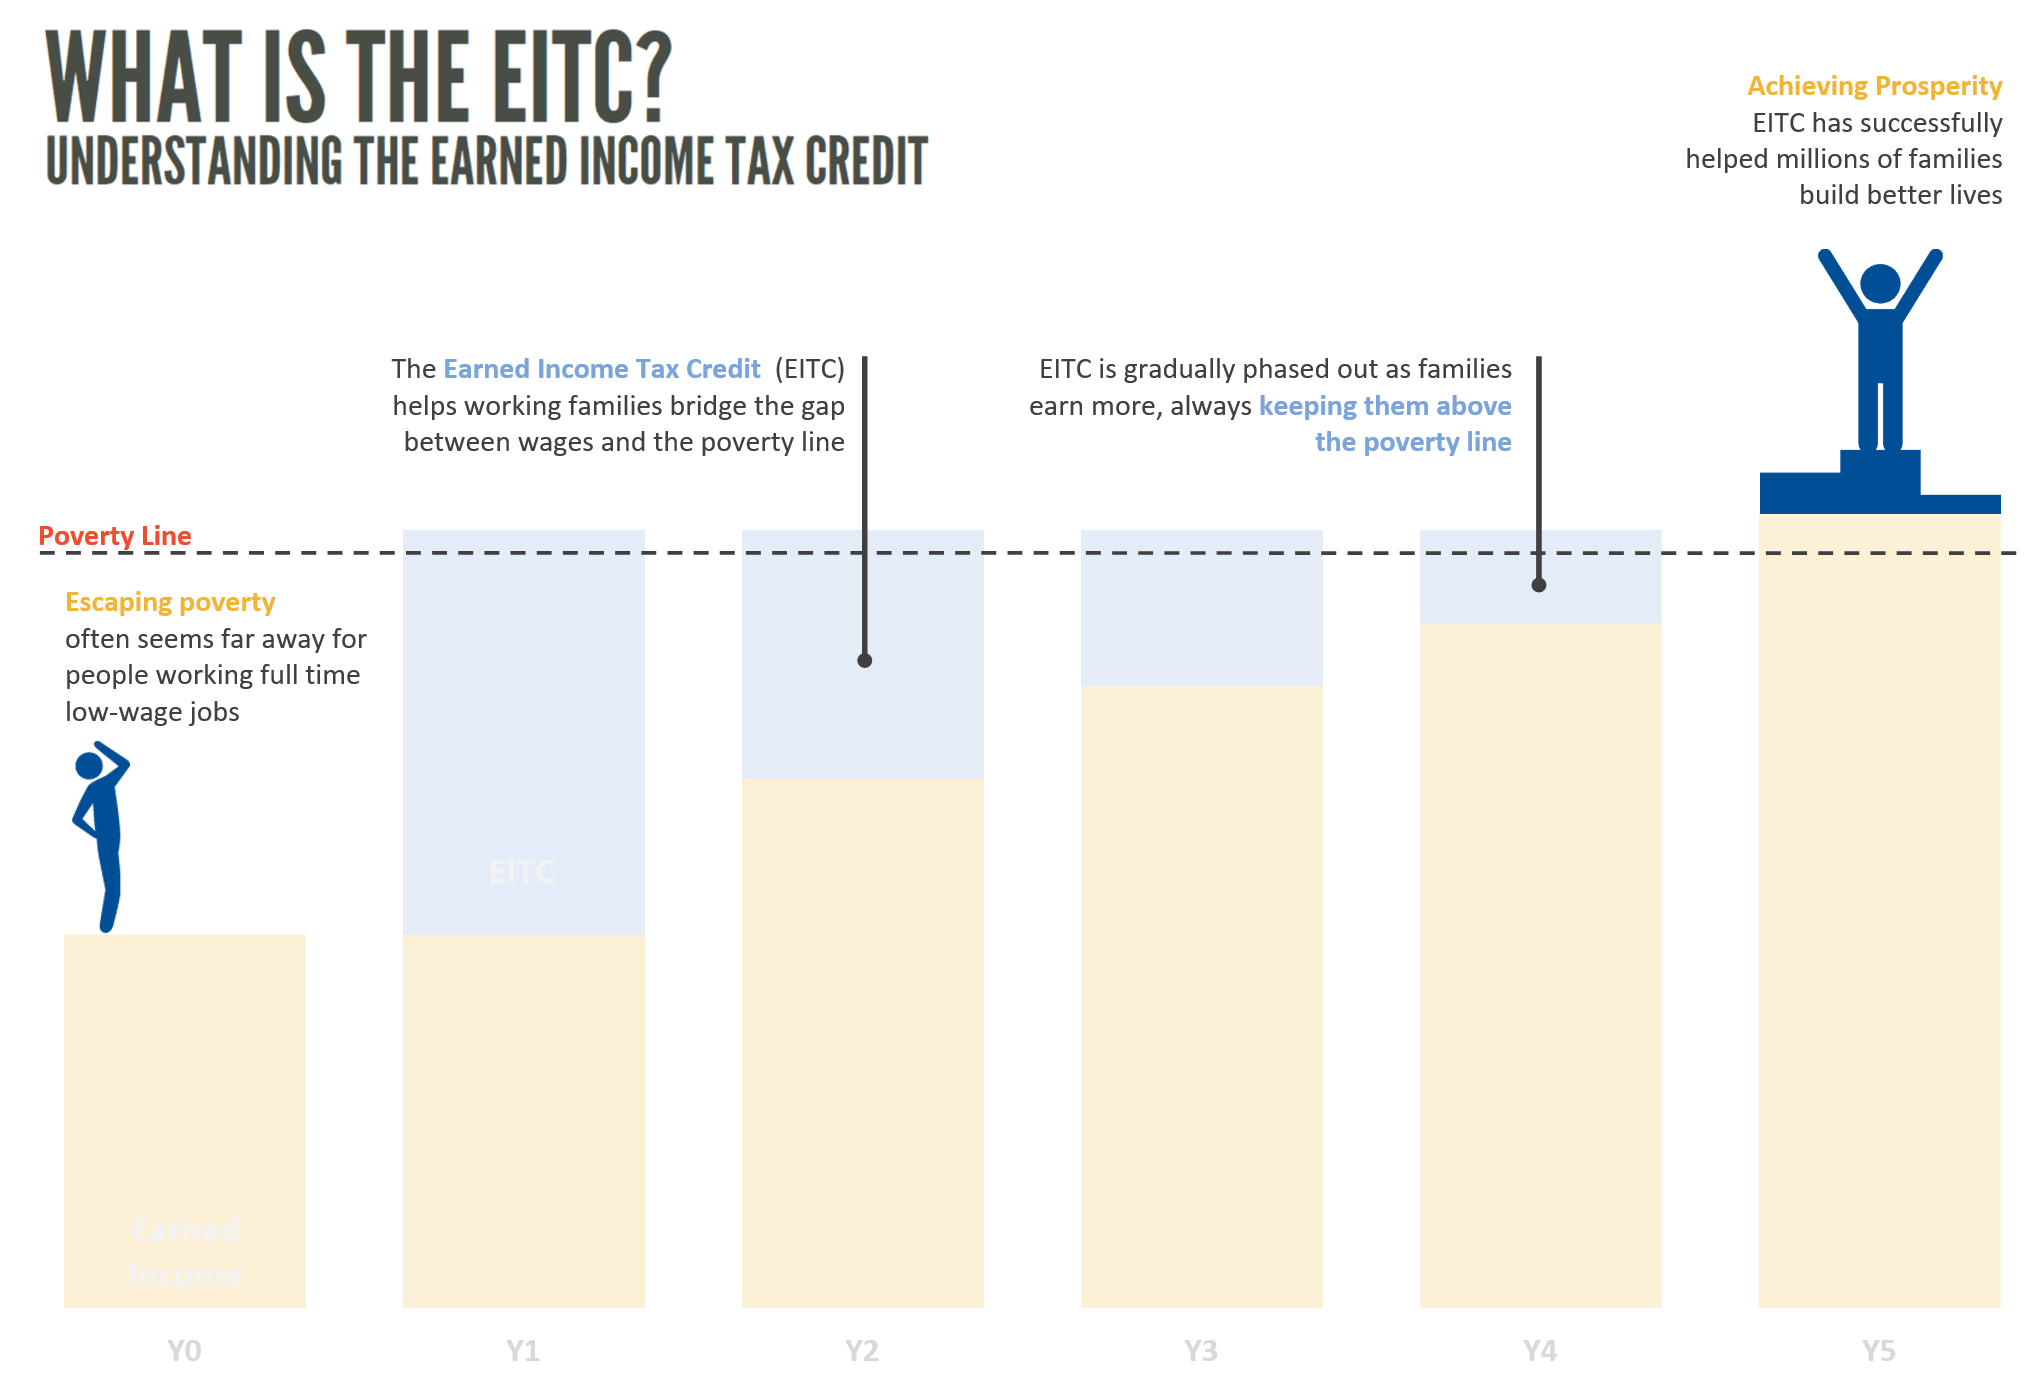
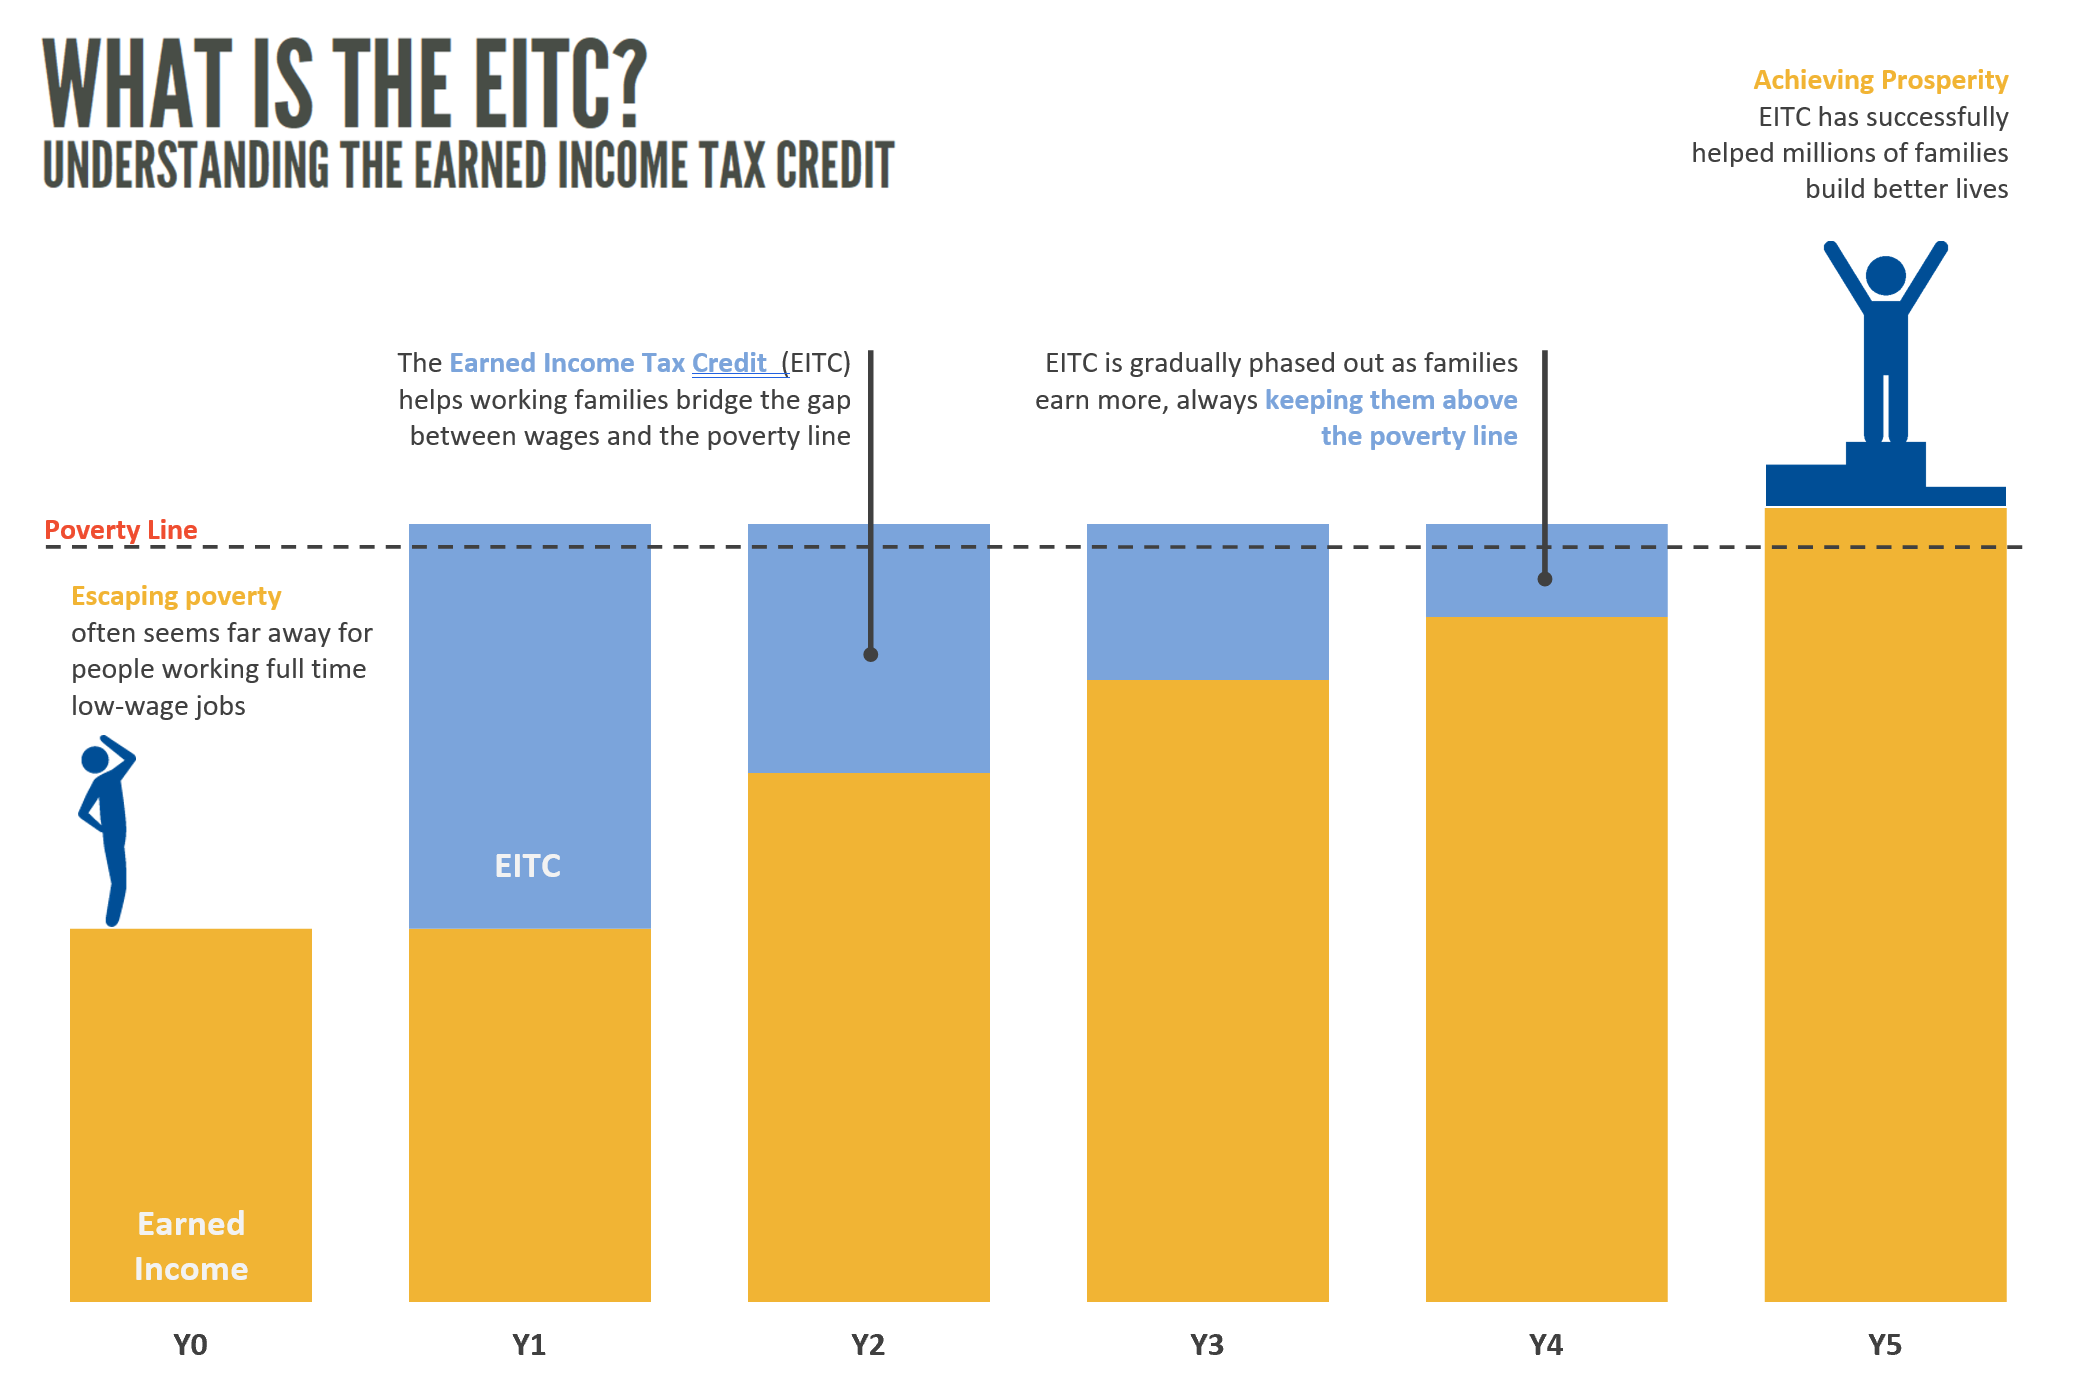
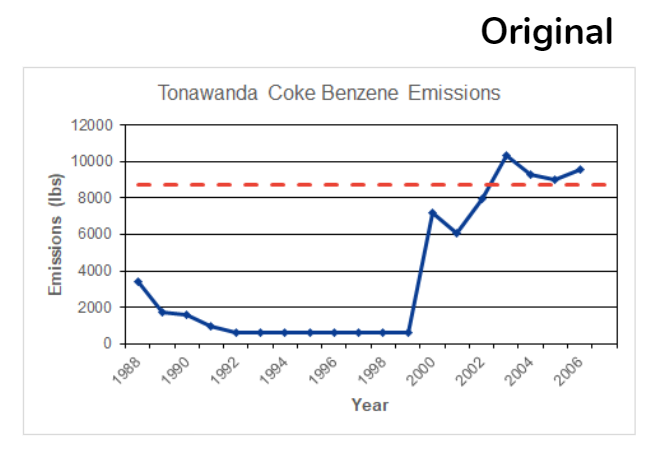
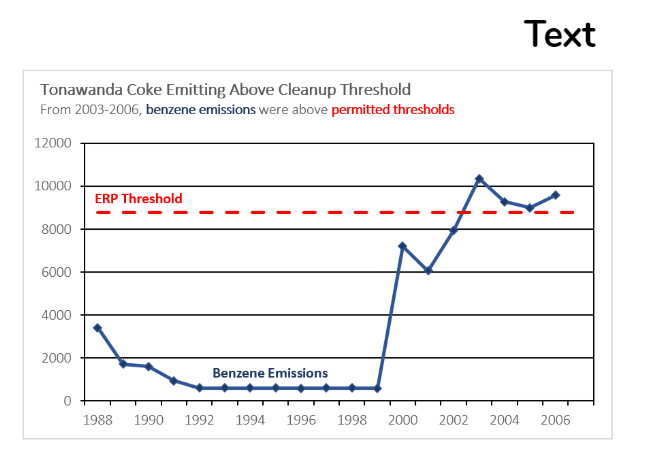
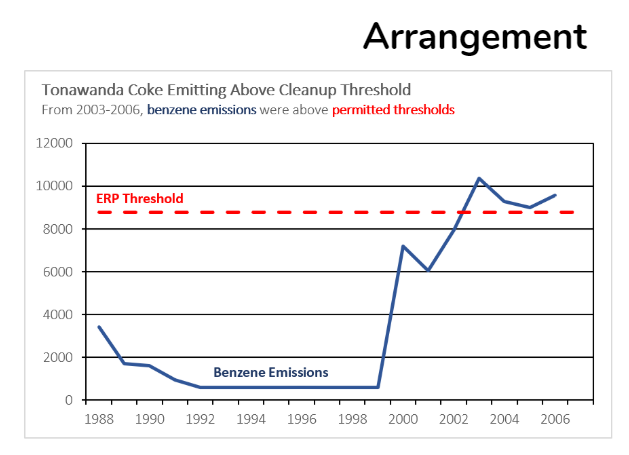
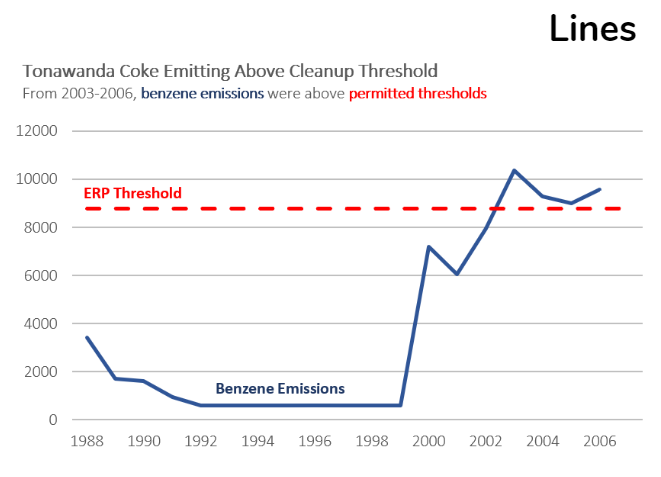
Using the concepts of content and scaffolding to structure your data visualization.
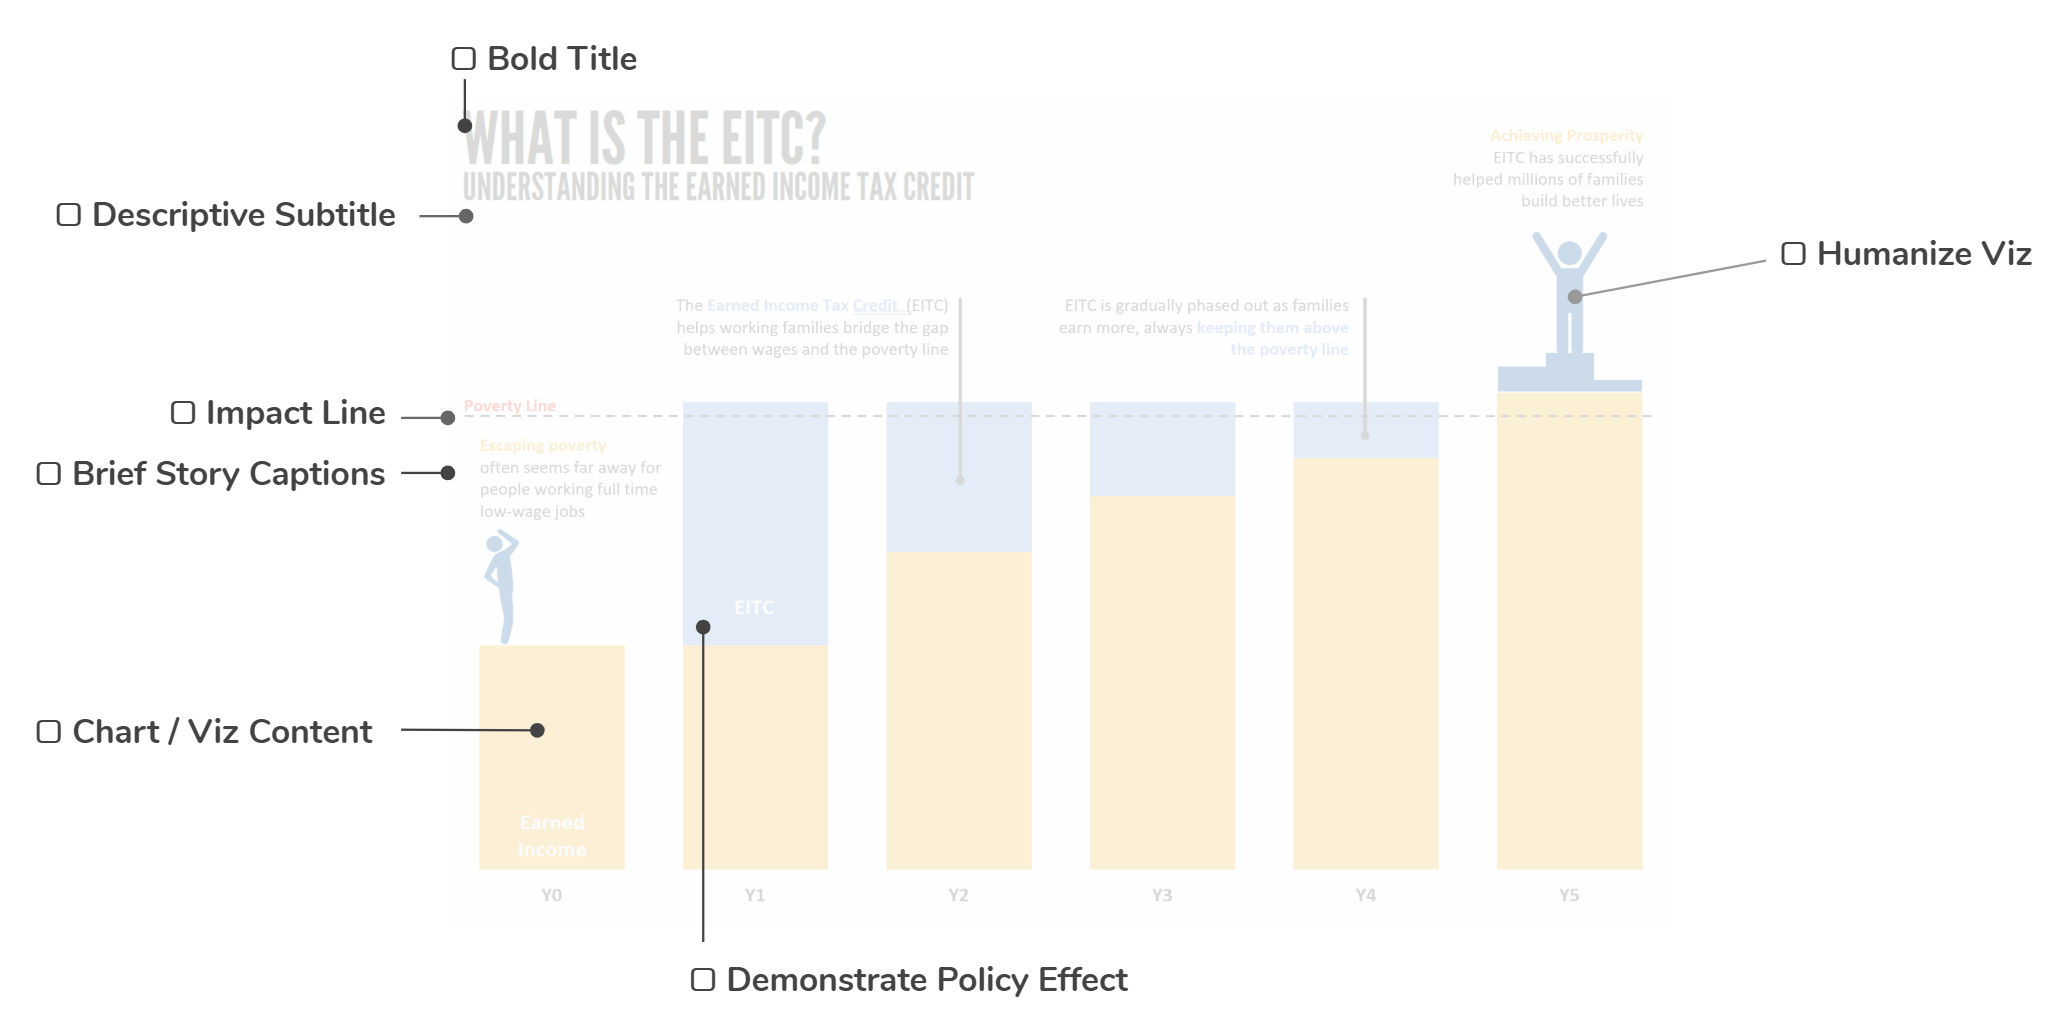
Use the Data Viz Checklist from Stephanie Evergreen and Ann Emery to revise a data visualization from the spreadsheet default settings.
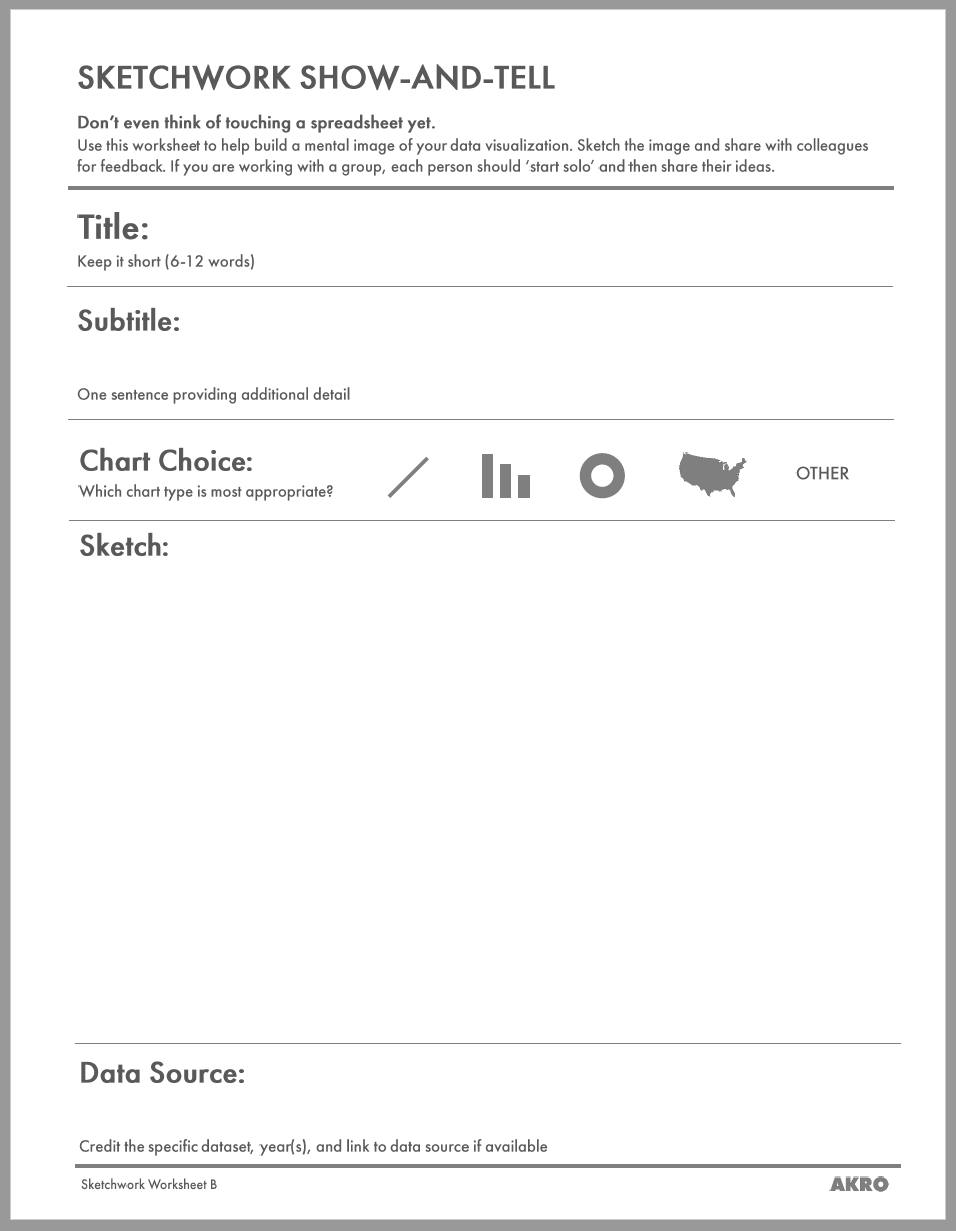
Data Visualization Worksheet
Download a .pdf version of this worksheet.
Resources
Evergreen Data | Data Viz Checklist, Best Practices, Blog
PolicyViz | Tutorials, best practices, data visualization catalog
Flowing Data | Examples, how-to, blog, R Studio tutorials
The Functional Art | Blog, examples, how-to, free learning resources